[A] My predictions for Graphs 21" and 14" were very similar, although my predictions for graph 7" was pretty off.
[B] The zeros of the graph represents where the skateboard had started rolling, the reason all the zeros are at (0,0)
[C] All graphs have the same Zeros and minimums, but their maximums differ because of the amount of gravity had affected the skateboard when falling down the different length ramps
[D] Each graph seemed to rise the fastest about 10 feet after launch, probably due to the driveway not being perfectly level.
Again since the driveway wasn't level, the graphs fall as well. For the 21" Ramp, the skateboard fell fastest about 5 second after reaching the maximum. 6 Second for the 14". Unfortunately for the the 7" ramp, the video cuts after it reaches maximum, giving us little evidence that the skateboard began to fall down the slope of the driveway again.
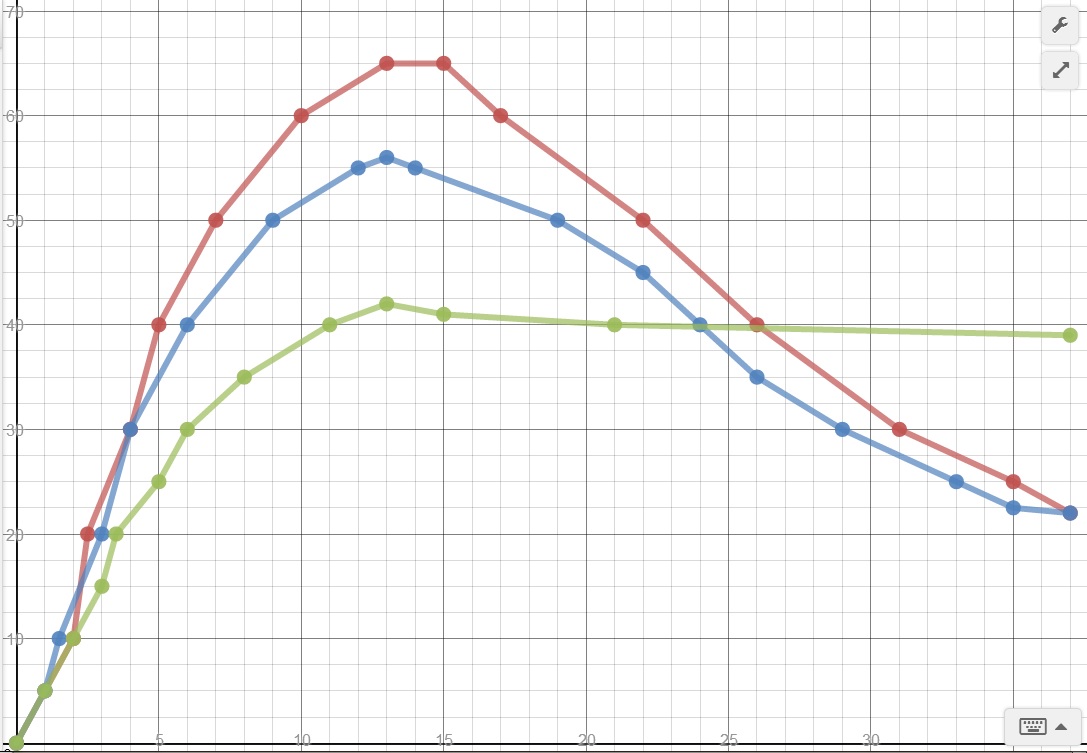
[E] These are the graphs that were made, Red representing 21", Blue representing 14", and Green is the 7".
The graph for 7" technically cuts off at the 15 second mark, the rest is educational guessing and predictions.
The graph for 7" technically cuts off at the 15 second mark, the rest is educational guessing and predictions.
 RSS Feed